Using Logstash, Elasticsearch and Kibana to get insight in my spending
March 2, 2014
I came up with the idea to import my bank transactions into ElasticSearch to see if I can get some nice statistics out of it with Kibana.
It turned out to be a interesting “weekend project” and gave some insights in my spending.
Importing into Elasticsearch
First I need to import the CSV files from my bank (Dutch ING bank) into ElasticSearch. Logstash is the ideal tool for this.
Config
I’m using the following config:
- Input: Look into the ‘bank’ folder for *.csv files and start reading from the beginning.
- Filter: The input is treated as CSV, every column is translated to a field with the corresponding name.
- Filter: We’re defining the ‘date’ field as timestamp of the event.
- Filter: The amount is imported as float value, this is needed for some calculations later.
- Output: Logstash has an embedded ElasticSearch, great for playing and testing.
- Output: Logstash creates an index per day by default. But I don’t have transactions every day, so create an index per month.
Starting import
The following command starts Logstash standalone with the embedded ElasticSearch and the webinterface.
java -Des.http.netty.maxInitialLineLength=16384 -jar logstash-1.3.3-flatjar.jar agent -f logstash-ing.conf -- web
Logstash will immediately start importing the CSV files into ElasticSearch. The ‘maxInitialLineLength’ needs to be raised to avoid the error:
TooLongFrameException: An HTTP line is larger than 4096 bytes.
Getting statistics out of it with Kibana
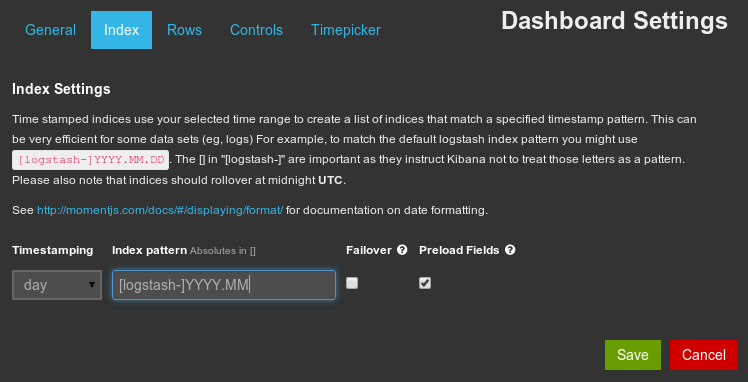
I now have all the bank transactions into ElasticSearch, but I want to get some statistics out of it. Logstash comes with a web interface called Kibana. Kibana is reachable on http://localhost:9292. The first thing I need to do is change the ‘index pattern’ to match the format I use in my config.
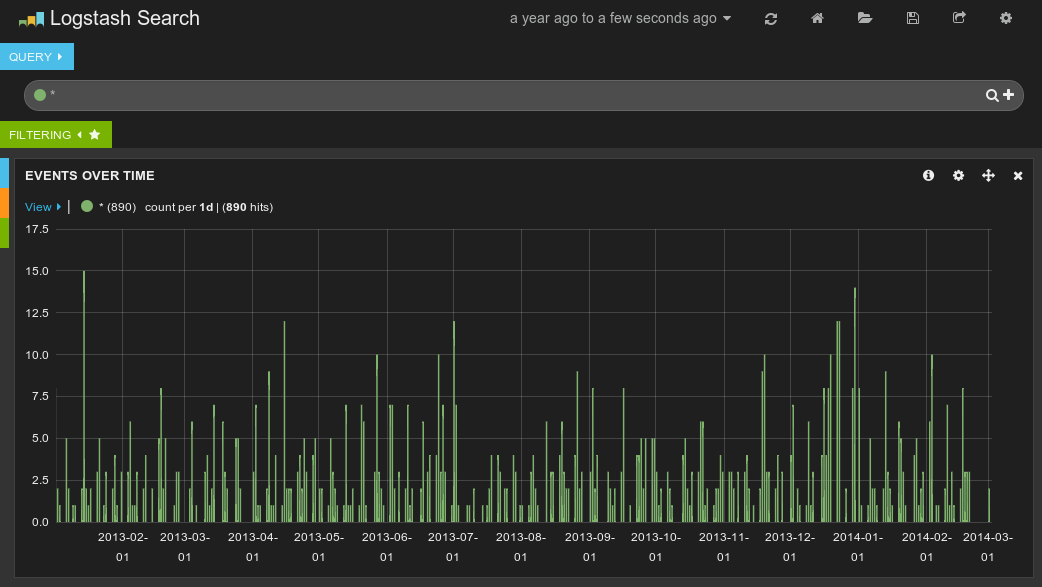
After that I can select a greater time span and should see the number of transactions per day in the histogram.
Incoming/outgoing per week
Seeing the number of transactions per day is nice, but I’m more interested in the amounts. I change the histogram to let it show the total amount per day:
- Click on the configure icon
- Go to ‘Panel’
- Choose ’total’ as Chart value
- Fill in the field name which stores the amount, in my case this is ‘amount’
- Save!
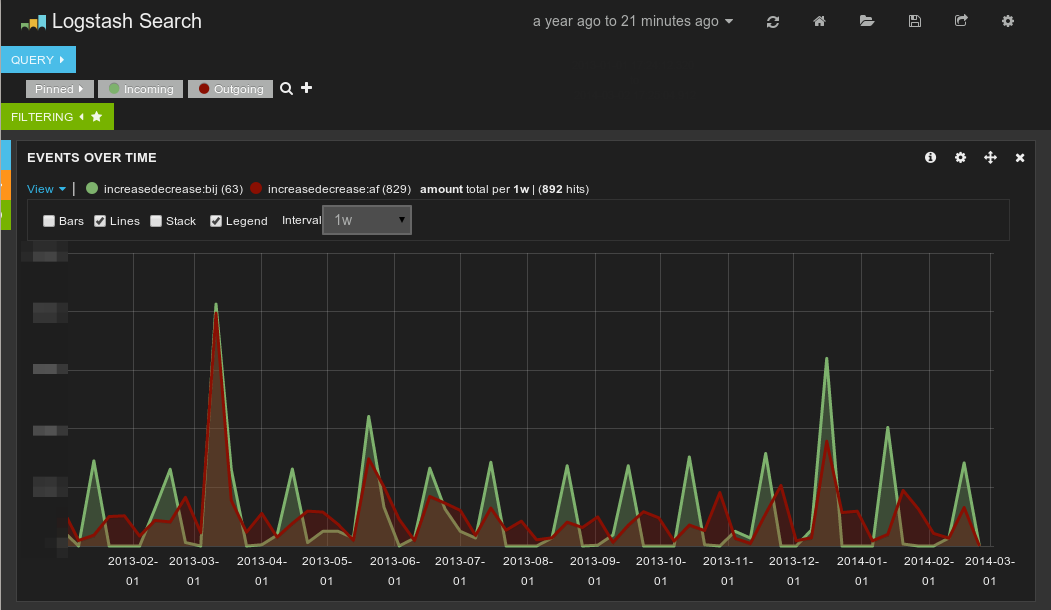
Now the histogram shows me the total amount instead of the number of transactions. If you click on ‘view’, you can change the interval to for example 1 week and you can choose to see lines instead of bars. Now I see the total amount, but I want to see the difference between incoming and outgoing. This can be done by creating 2 queries: one that filters on incoming, one that filters on outgoing. In my case I have a ‘increasedecrease’ field that I can use to query on. ‘af’ means outgoing, ‘bij’ means incoming.
By click on the colored dot in front of the query you can ‘pin’ the query and alias it.
This gives a nice result.
Totals
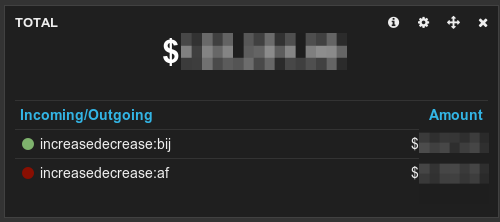
To see the total amount and the amount per query I create a new ‘stats’ panel like
this:
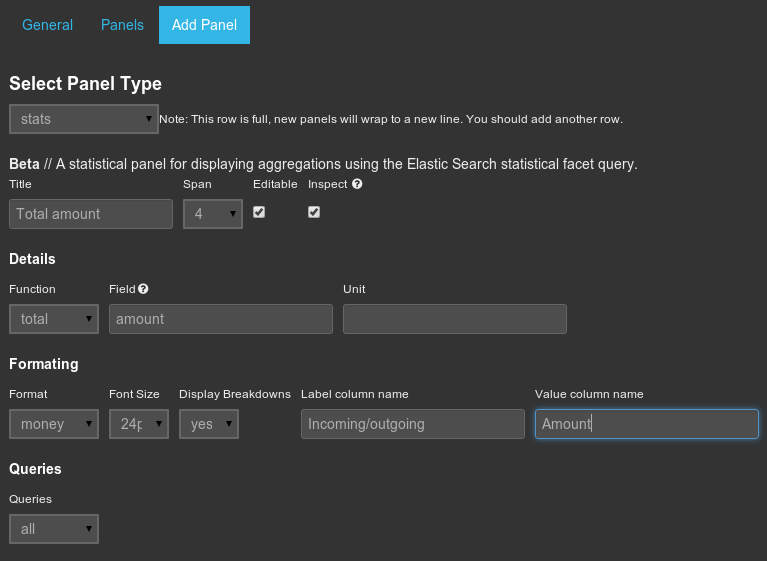
Now I can see the amount incoming/outgoing for the selected time.
This gave me a nice start to dive deeper into my spending and create new queries based on a specific description, for example to see how much I spent on my?mortgage. Try it yourself, it’s fun and gives you?enormous possibilities!
Go backDon’t forget to save your dashboard!