Monitor business KPIs using the OpenMetrics standard
February 27, 2022
Visualizing business KPIs in a dashboard and being able to cross-reference metrics from different areas is hard when you have to deal with multiple systems. You probably have systems for finance, HR, CRM, support, etc. and of course also a lot of spreadsheets to glue everything together.
In this article I’ll explain a way to gather all the important metrics from different systems, store them in one place and visualize them in a dashboard.
The idea
Almost every system we use nowadays has an API. We could ‘simply’ build an application that consumes all the APIs from the different systems, store the data somewhere and create graphs to visualize the KPIs. But there’s a smarter way that doesn’t involve a lot of code and a lot of work. Instead, we use an open standard and open source software.
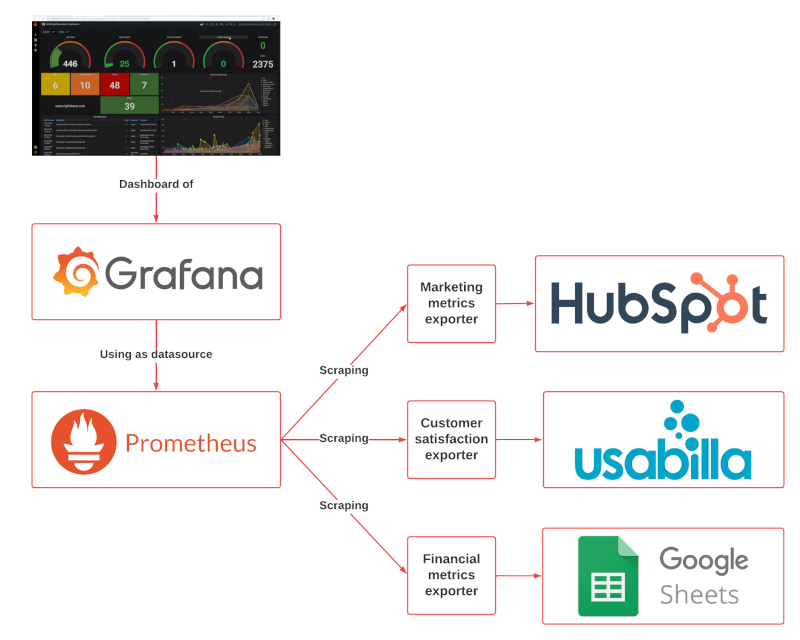
This is how it works;

- Starting from the top you see the dashboard that shows the most important business KPIs on a single dashboard.
- The dashboard is created in Grafana, and Grafana uses Prometheus as datasource for all the metrics.
- Prometheus gathers the metrics by scraping the metric exporters at a defined interval.
- The metrics exporters are small custom-made applications that collect the metrics from the system and expose them in the OpenMetrics format.
Metrics exporter
The metrics exporter is the key component. This is where you need to write a bit of code to fetch the metrics from the API of the system you want to utilize. Since there are tons of libraries available for most systems and languages, it should be fairly easy to build an exporter for every system you want to include in the dashboard.
The exporter needs to expose a /metrics API endpoint which returns the gathered metrics in
the OpenMetrics format. This is a format that Prometheus (and others) can interpret. Since
it’s an open standard, there are also a lot of libraries available for most languages. Just search for ‘open metrics’ or
‘prometheus client’ in the package manager of your favorite language.
NodeJS example
The example below shows how to expose a metric that reflects the number of feedback received via Usabilla. It has a
label source to specify the number of feedback received per source.
import express from 'express';
import client from 'prom-client';

const server = express();

// Configure the metric
const feedbackCountMetric = new client.Gauge({
    name: 'usabilla_feedback_count',
    help: 'Number of feedback received',
    labelNames: ['source'],
});

// Let the server response on requests to /metrics
server.get('/metrics', async (req, res) => {
    try {

        // These numbers need to be fetched from the Usabilla API
        const nrFeedbackViaEmail = 12;
        const nrFeedbackViaInPage = 3;

        // Set the value of the metric
        feedbackCountMetric.set({'source': 'email'}, nrFeedbackViaEmail);
        feedbackCountMetric.set({'source': 'inpage'}, nrFeedbackViaInPage);

        // Send the response in the OpenMetrics format
        res.set('Content-Type', client.register.contentType);
        res.end(await client.register.metrics());
    } catch (ex) {
        res.status(500).end(ex);
    }
});

// Start the HTTP server
server.listen(3001, async () => {
    console.log('Listing on port 3001');
});
How it works; when a request to http://localhost:3001/metrics is received, the exporter will fetch the latest numbers
from the Usabilla API and give the response in the OpenMetrics format;
# HELP usabilla_feedback_count Number of feedback received
# TYPE usabilla_feedback_count gauge
usabilla_feedback_count{source="email"} 12
usabilla_feedback_count{source="inpage"} 3
Prometheus
Prometheus is the heart of the system. It consists of a few components that make it ideal for this use-case;
- A time series database
- A pull-based scraping engine
- A very flexible query language
In Prometheus you can configure the endpoint of the exporter as scrape target;
scrape_configs:
- job_name: usabilla-metrics
  scrape_interval: 60s
  static_configs:
  - targets:
    - localhost:3001
This tells Prometheus to call the /metrics endpoint of the exporter every 60 seconds and store the metrics in its
time-series database.
Grafana
The last component is Grafana. Grafana is an application that allows you to visualize the
metrics on a dashboard. By using Prometheus as datasource in Grafana it enables you to create fancy graphs with the
metrics data stored in Prometheus. With the Usabilla example above we can easily create a graph that shows the
number of feedback
received over time by just querying the usabilla_feedback_count metric.
Bonus: Alerting
One other feature of Prometheus that can be very interesting for this use-case is alerting. You can define rules based on the metrics that trigger an alert. For example, the alert below will warn you when the number of feedback received is less than 5 over the last 24 hours. This could indicate an issue with Usabilla when you would normally receive a lot more feedback over the course of the day.
increase(usabilla_feedback_count[24h]) < 5