Debugging Varnish requests with varnishncsa
June 2, 2014
Varnish provides some tools to help you monitor and debug Varnish’ health. One of those tools is varnishncsa. When you run it without arguments it shows a real-time access log in the Apache combined log format. That’s nice and can come in handy. But, it really gets interesting when you define your own format like this:
varnishncsa -F '%t %r %s %b %{Varnish:time_firstbyte}x %{Varnish:handling}x'
This will give the following output:
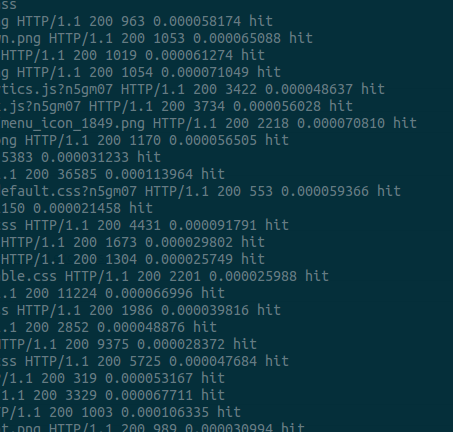
[03/Jun/2014:14:55:54 +0200] GET http://<domain>/<page> HTTP/1.1 200 493 0.167023897 pass
The last two are the interesting values:
0.167023897: is the time Varnish needed to parse the request and return the response. This includes the time needed to fetch it from the backend.pass: can also be hit or miss and tells you whether Varnish could serve this request from cache or passes it through to the backend.
This makes it easy to see which requests are hurting the backend and need some attention.
Go back